| Decile1 | Count of Candidates in Decile 1 (Exam) that match this response |
| Decile2 | Count of Candidates in Decile 2 (Exam) that match this response |
| Decile3 | Count of Candidates in Decile 3 (Exam) that match this response |
| Decile4 | Count of Candidates in Decile 4 (Exam) that match this response |
| Decile5 | Count of Candidates in Decile 5 (Exam) that match this response |
| Decile6 | Count of Candidates in Decile 6 (Exam) that match this response |
| Decile7 | Count of Candidates in Decile 7 (Exam) that match this response |
| Decile8 | Count of Candidates in Decile 8 (Exam) that match this response |
| Decile9 | Count of Candidates in Decile 9 (Exam) that match this response |
| Decile10 | Count of Candidates in Decile 10 (Exam) that match this response |
| Distribution1 | Count of Candidates in top 20% (Exam) that match this response |
| Distribution2 | Count of Candidates in 20% to 40% (Exam) that match this response |
| Distribution3 | Count of Candidates in 40% to 60% (Exam) that match this response |
| Distribution4 | Count of Candidates in 60% to 80% (Exam) that match this response |
| Distribution5 | Count of Candidates in bottom 20% (Exam) that match this response |
| Correct | True if the response is considered a correct option for Multiple Choice Items or is a passing value for Essay Items |
| DistBottom50 | Count of Candidates in bottom 50% (Exam) that match this response |
| DistTop50 | Count of Candidates in top 50% (Exam) that match this response |
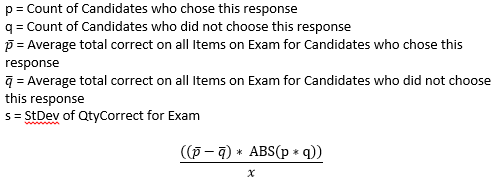
| Biserial |  |
| Sequence | Sequence of Item on the Exam |
| ValueMax | Maximum achievable points for Item |
| QtyCorrect | Total of all QtyCorrect for Item for all Candidates |
| QtySkipped | Total of all QtySkipped for Item for all Candidates |
| QtyIncorrect | Total of all QtyIncorrect for Item for all Candidates |
| RawPercent | x = Count of Correct Items on Exam
n = Count of Candidates on Exam
 |
| ValueCorrect | Total of all ValueCorrect for Item for all Candidates |
| ValueSkipped | Total of all ValueSkipped for Item for all Candidates |
| ValueIncorrect | Total of all ValueIncorrect for Item for all Candidates |
| ValueTotal | (ValueCorrect + ValueSkipped + ValueIncorrect) |
| ValuePercent |  |
| Difficulty | x = Count of Correct Items on Exam
n = Count of Candidates on Exam
 |
| QuestionDiscrimination | A value between -1 and 1
Q1 is the Count of Candidates who responded correctly to Item whose Value total is in the top 27% of all Candidates taking the Exam.
Q4 is the Count of Candidates who responded correctly to Item whose Value total is in the top 27% of all Candidates taking the Exam.
n = Count of Candidates
 |
| BiserialExam |  biserials biserials |
| PointBiserialExam | m1 = Mean of correct on Exam for all Candidates that answered correctly.
m0 = Mean of correct on Exam for all
Candidates that answered incorrectly.
n1 = Count of all Candidates that answered correctly.
n0 = Count of all Candidates that answered incorrectly.
s = Standard deviation of Candidate correct on Exam
n = Total number of Candidates on Exam
 |
| BiserialCorrectedExam |  biserials biserials |
| PointBiserialCorrectedExam |  biserials biserials |
| BiserialSection |  biserials biserials |
| PointBiserialSection | m1 = Mean of correct on Exam for all Candidates that answered correctly.
m0 = Mean of correct on Exam for all
Candidates that answered incorrectly.
n1 = Count of all Candidates that answered correctly.
n0 = Count of all Candidates that answered incorrectly.
s = Standard deviation of Candidate correct on Exam
n = Total number of Candidates on Exam
 |
| BiserialCorrectedSection |  biserials biserials |
| PointBiserialCorrectedSection |  biserials biserials |
| BiserialCompetency |  biserials biserials |
| PointBiserialCompetency | m1 = Mean of correct on Exam for all Candidates that answered correctly.
m0 = Mean of correct on Exam for all
Candidates that answered incorrectly.
n1 = Count of all Candidates that answered correctly.
n0 = Count of all Candidates that answered incorrectly.
s = Standard deviation of Candidate correct on Exam
n = Total number of Candidates on Exam
 |
| BiserialCorrectedCompetency |  biserials biserials |
| PointBiserialCorrectedCompetency |  biserials biserials |
| ValueLow | Lowest ValueTotal achieved by a Candidate for this Item |
| ValueHigh | Highest ValueTotal achieved by a Candidate for this Item |
| ValueMean | Mean (average) ValueTotal achieved by a Candidate for this Item |
| ValueStdev | Standard Deviation of ValueTotal for all Candidates for this Item |
| ValueVariance | Variance of ValueTotal for all Candidates for this Item |
| ValueMedian | Median (middle) ValueTotal for all Candidates for this Item |
| ValueMode | Mode (most frequent) ValueTotal for all Candidates for this Item |
| QtyCorrectTop50 | Count of Candidates who responded correctly to Item whose Value total was in top 50% of all Candidates taking Exam |
| QtyCorrectBottom50 | Count of Candidates who responded incorrectly to Item whose Value total was in top 50% of all Candidates taking Exam |
| TimeTotal | Total Time for all Candidates on this Item. Used in Online testing  link link |
| Dichotomous | True if Item has one correct response worth 1 point and all other responses are incorrect worth 0 points. |
| IncludeInStats |  explain explain |


 biserials
